

At Koodos Labs, we are building a personal context model: one dynamic representation of a person, assembled from the services they connect to Shelf and whatever else a user chooses to add or correct, that AI experiences can draw on. To include something in this representation, it must be something we have solid grounds to believe is true about the person.
So, to enrich this representation, we used what we already have - volumes of digital footprints of what people listen to, watch and read - to infer something about users that we don’t know; we started with personality. Personality is well defined, well measured, and a decade of research on predicting it from digital traces means there are published numbers we can measure our efforts against.
Thus, we asked thousands of Shelf users to take a standard personality questionnaire, then trained models to predict their answers from their digital exhaust. The result is a state-of-the-art inference of latent personality traits from passive media footprints.
What we already knew
The field of digital phenotyping, inferring personality traits from a person’s digital exhaust, took off around 2013. A canonical result that instigated the research area showed that a model given nothing but a person’s Facebook Likes could predict their self-reported personality remarkably well (Kosinski et al., 2013). Two years later, the same group showed how far that goes: given enough Likes, a model judged a person’s personality as well as their friends did, and with a few hundred Likes, better than their spouse (Youyou et al., 2015). Follow-up work found the same in the words people write: the language of Facebook status updates predicts personality about as well as Likes do (Schwartz et al., 2013; Park et al., 2015).
The meta-analyses tell the more interesting story. Pool every study of this kind, across Likes, text, profiles and whatever else a platform records, and the results converge (Azucar et al., 2018). The strength of the relationship between the personality scores predicted from a person’s digital footprint and their self-reported personality is moderate (r between 0.29 and 0.40), meaning that reflections of our personality reliably and robustly show up in the actions we take in the digital world.
Still, Likes, posts and statuses require an active choice, something a person has chosen to write or endorse. Not all digital behaviors are like that. A play, a watch or an app open is a passive action, recorded as a side effect of living, and is thus a noisier signal of our deeper personality.
Nonetheless, extant research has also shown that such passive digital exhaust still reveals something about our personality. Studies that track smartphone use, including app use, screen time, movement and communication logs, show that these kinds of digital signals are about 80% as good in inferring personality traits as active digital footprints (Marengo et al., 2023; Stachl et al., 2020).
Music listening is also like that. The same relationships show up when the basis for inferring users’ personality comes from Spotify listening history, combined with basic demographic data (Anderson et al., 2021). Even if only music listening history is used, without demographics, researchers have still been able to predict users’ personality traits (Sust et al., 2023).
What we did
The Big Five, the field’s canonical way to operationalize personality, consists of five traits: openness, conscientiousness, extraversion, agreeableness and neuroticism. We measured them with the 44-item Big Five Inventory (John & Srivastava, 1999), split into five short questionnaires inside the app, one per trait, each item answered 1 to 5. Internal consistency in our sample was 0.64 to 0.78, the usual range for a short inventory.
Users took the questionnaires voluntarily in two promoted bursts in August 2026 using our in-app platform. We got a few thousand responses for each trait. This gave us a ground truth personality score that we could train models on.
For the users who completed the questionnaires, we fetched their digital footprints. Most of the data we held was Spotify listening history, simply because this was one of the first platform connections we had built and thus most users have their Spotify accounts connected and data available.
Then we hand-built 170 features, broadly split into families the literature points at: how much and how regularly someone listens; what they listen to, as shares across sixteen genre families, album versus single releases and repeat rate; viewing habits per service; and app use, such as session rhythm and breadth of sections visited.
The biggest single lever we included is something we call taste coordinates. Think of every artist on Spotify as a point on a map, placed so that artists with the same listeners sit near each other. Then place each person on that map according to where their listening goes. In practice, the map is a truncated singular value decomposition (SVD): take the table of how much each user listened to each artist and compress it to the hundred directions along which listening habits vary together, so the map has a hundred dimensions rather than two. We fit it on a quarter of a million users who never took the questionnaire, so nobody’s position is shaped by their own answers. It is the same idea that powers recommendation engines, and it has a track record in this field (Kosinski et al., 2013). That brings the model to 270 predictors.
The models are plain linear models, ridge and elastic net, one per trait: weighted sums of the features, with a penalty that keeps the weights small or drops features outright. Linear on purpose: a few thousand labels do not support anything fancier. Users were split into training (70%), test (20%) and holdout (10%) sets. The headline metric is the Pearson correlation between predicted and self-reported score on users the model never trained on, from nested 10-fold cross-validation, where the model is chosen inside each fold so no number is tuned on the users it is reported on.
What we found
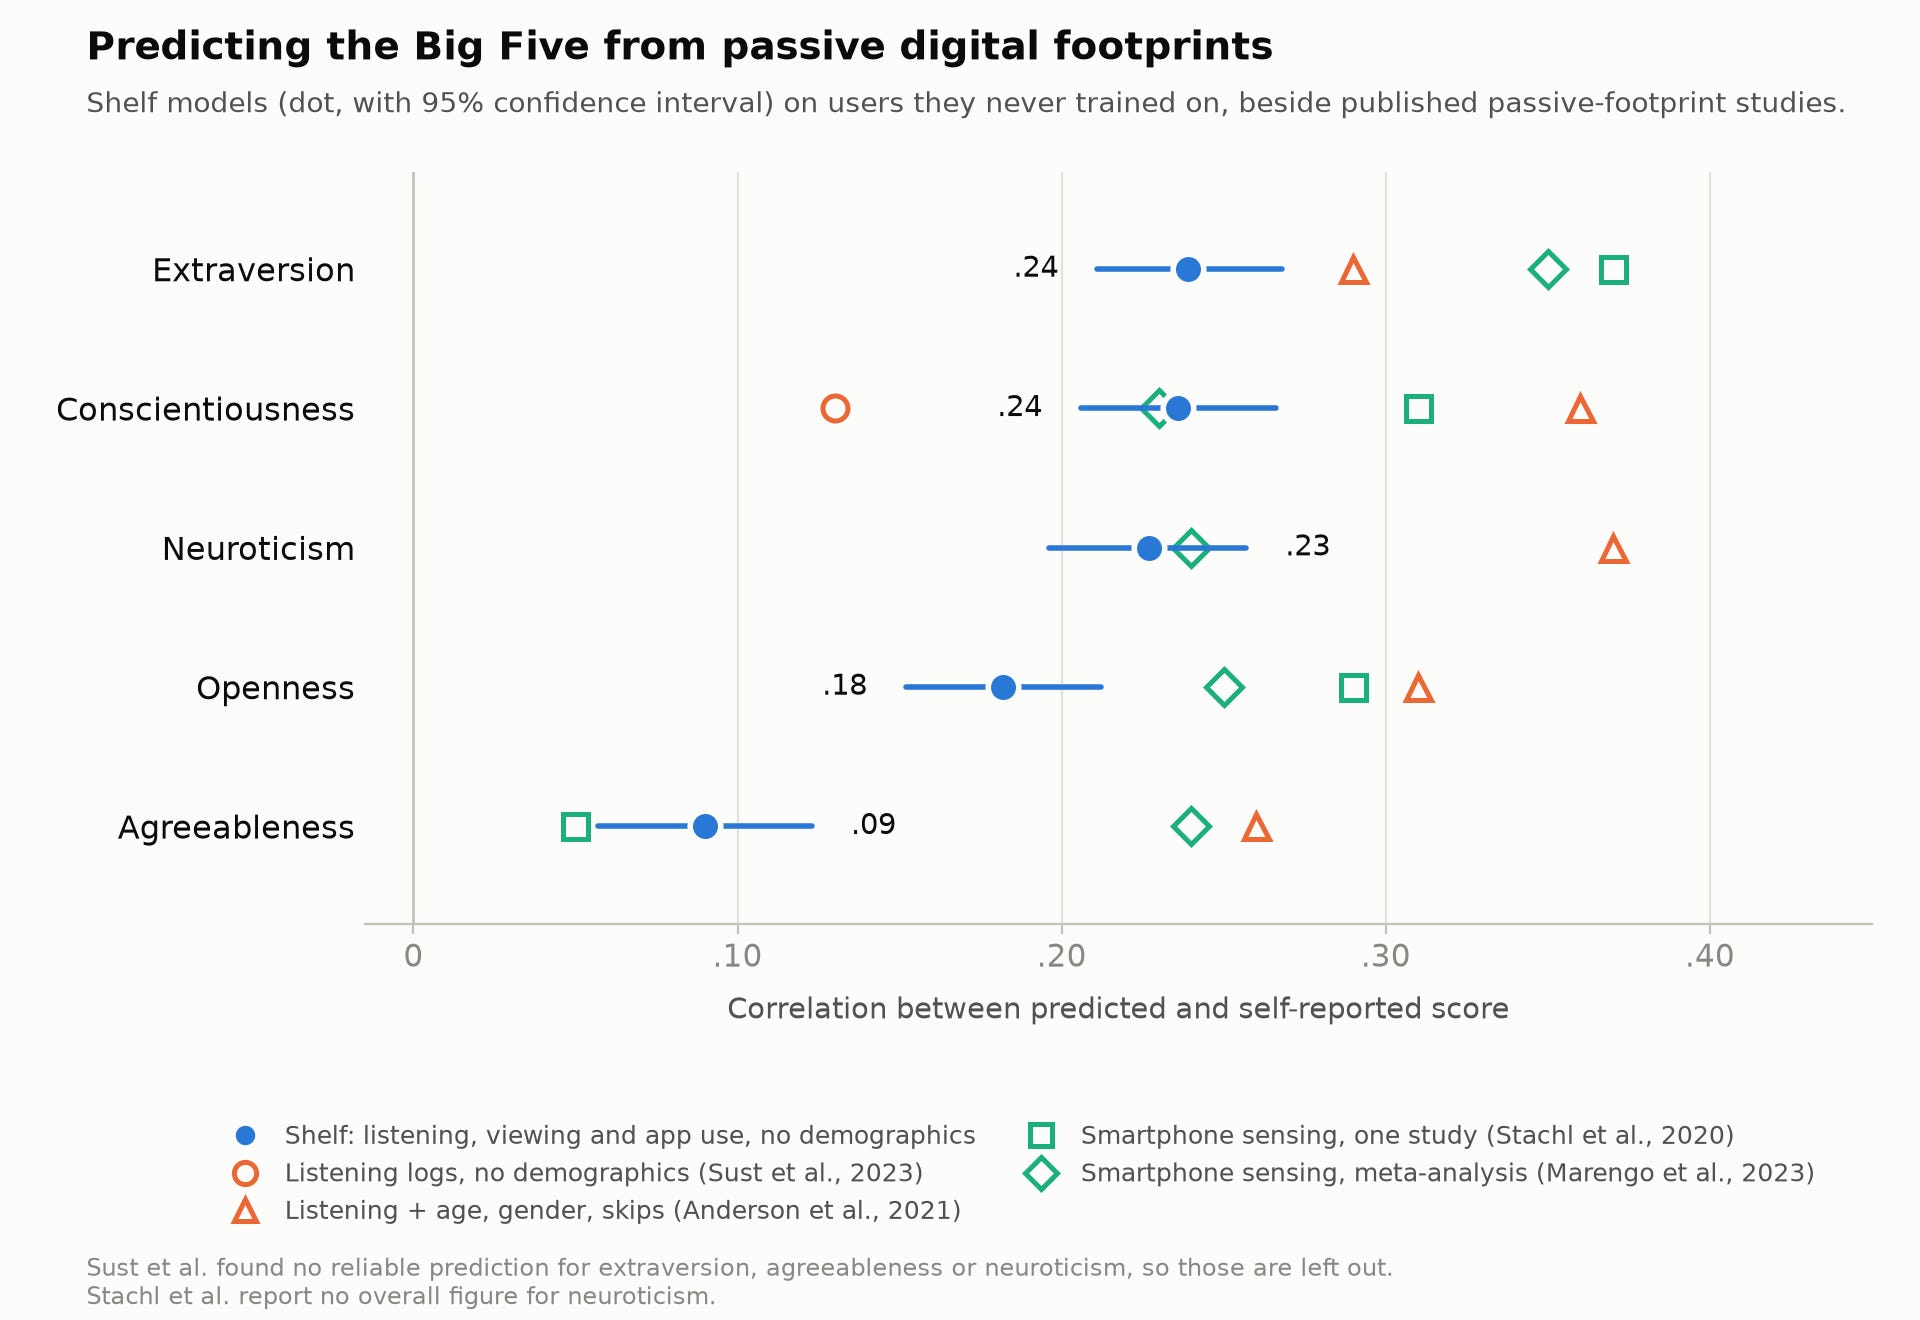
The chart shows, for each of the five traits, how strongly our model’s predictions line up with what people reported about themselves, measured on users the model never trained on, with the published studies alongside for scale. Three traits come out strongest: extraversion, conscientiousness and neuroticism, each near the top of what any passive footprint has achieved. Openness sits in the middle. Agreeableness, the trait that defeats every study in this literature, is the weakest for us too.
Set against the studies we can compare with directly, the picture is a good one. We beat the closest design to ours, listening logs alone with no demographics (Sust et al., 2023), on four of the five traits, trailing only on openness. Smartphone sensing sees everything a phone records rather than media alone, and we are within a margin of error on almost all traits. The Spotify study (Anderson et al., 2021) stays above us on every trait, but it had age, gender, subscription status and skipping behavior in the model, and its authors credit age and gender with much of the lift. We had none of that. On a passive media footprint alone, this is the strongest result we know of.
Two things suggest the true relationships are stronger than the chart shows. The questionnaire’s own reliability caps the correlation any model can reach; with reliabilities of 0.64 to 0.78, a true 0.30 shows up as 0.24 to 0.27. And our users skew high and tightly bunched on openness, which leaves less variation to predict on the field’s usually easiest trait; a broader sample would likely close that gap. The remaining caveats are the ordinary ones: the cohort is self-selected, and the labels come from one sitting.
Where this goes
Step back to where we started. A representation of a person built from passive media traces recovers self-reported personality at the level of the best passive-footprint studies, from listening alone, with no demographics and nothing anyone typed. A mapping of one’s personality lives in their personal context model, derived from behavior the person never had to describe or self-report. Our hypothesis here is that personality is one form of compression of one’s identity that can provide significant uplift on downstream tasks.
But this is just the beginning. Do you see ways to improve on this? Other things a media footprint could predict? We have heaps of data we are trying to make sense of and to put in the service of users. If you’d like to join us on this mission, we’d love to hear from you!
References
Anderson, I., Gil, S., Gibson, C., Wolf, S., Shapiro, W., Semerci, O., & Greenberg, D. M. (2021). “Just the way you are”: Linking music listening on Spotify and personality. Social Psychological and Personality Science, 12(4), 561–572. https://doi.org/10.1177/1948550620923228
Azucar, D., Marengo, D., & Settanni, M. (2018). Predicting the Big 5 personality traits from digital footprints on social media: A meta-analysis. Personality and Individual Differences, 124, 150–159. https://doi.org/10.1016/j.paid.2017.12.018
John, O. P., & Srivastava, S. (1999). The Big Five trait taxonomy: History, measurement, and theoretical perspectives. In L. A. Pervin & O. P. John (Eds.), Handbook of personality: Theory and research (2nd ed., pp. 102–138). Guilford Press.
Kosinski, M., Stillwell, D., & Graepel, T. (2013). Private traits and attributes are predictable from digital records of human behavior. Proceedings of the National Academy of Sciences, 110(15), 5802–5805. https://doi.org/10.1073/pnas.1218772110
Marengo, D., Elhai, J. D., & Montag, C. (2023). Predicting Big Five personality traits from smartphone data: A meta-analysis on the potential of digital phenotyping. Journal of Personality, 91(6), 1410–1424. https://doi.org/10.1111/jopy.12817
Park, G., Schwartz, H. A., Eichstaedt, J. C., Kern, M. L., Kosinski, M., Stillwell, D. J., Ungar, L. H., & Seligman, M. E. P. (2015). Automatic personality assessment through social media language. Journal of Personality and Social Psychology, 108(6), 934–952. https://doi.org/10.1037/pspp0000020
Schwartz, H. A., Eichstaedt, J. C., Kern, M. L., Dziurzynski, L., Ramones, S. M., Agrawal, M., Shah, A., Kosinski, M., Stillwell, D., Seligman, M. E. P., & Ungar, L. H. (2013). Personality, gender, and age in the language of social media: The open-vocabulary approach. PLoS ONE, 8(9), e73791. https://doi.org/10.1371/journal.pone.0073791
Stachl, C., Au, Q., Schoedel, R., Gosling, S. D., Harari, G. M., Buschek, D., Völkel, S. T., Schuwerk, T., Oldemeier, M., Ullmann, T., Hussmann, H., Bischl, B., & Bühner, M. (2020). Predicting personality from patterns of behavior collected with smartphones. Proceedings of the National Academy of Sciences, 117(30), 17680–17687. https://doi.org/10.1073/pnas.1920484117
Sust, L., Stachl, C., Kudchadker, G., Bühner, M., & Schoedel, R. (2023). Personality computing with naturalistic music listening behavior: Comparing audio and lyrics preferences. Collabra: Psychology, 9(1), Article 75214. https://doi.org/10.1525/collabra.75214
Youyou, W., Kosinski, M., & Stillwell, D. (2015). Computer-based personality judgments are more accurate than those made by humans. Proceedings of the National Academy of Sciences, 112(4), 1036–1040. https://doi.org/10.1073/pnas.1418680112